





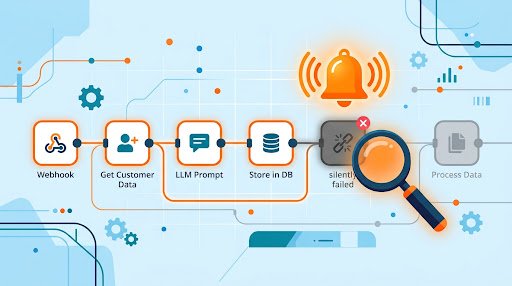
LLM automation monitoring should detect missing business outcomes, not only exceptions. An n8n workflow may not produce a visible error when it never starts, waits too long, processes only part of its work, or receives an LLM response that is technically successful but unusable. The monitoring design needs to make those conditions visible to an owner before a sales, operations, or support team notices the impact.
Treat each important automation as a service with an expected cadence, a defined completion condition, and a recovery path. n8n provides an execution view for reviewing successful, failed, running, and waiting executions, along with retry options for failed runs. That is useful for investigation, but it is not proactive detection: someone must first decide to inspect it. n8n’s execution documentation describes that investigation surface.
What makes an LLM automation fail silently?
Some failures are explicit. A downstream API returns an error, a node stops, and the workflow is marked failed. Other failures are business failures without a clear application error:
- A scheduled workflow does not begin when expected.
- An event-driven workflow stops receiving valid triggers.
- An execution starts but never reaches a critical downstream step.
- A durable write succeeds for some records but not all required records.
- An LLM response arrives but fails deterministic validation.
- Retries continue until the useful business deadline has passed.
These conditions require different signals. Error alerts catch explicit crashes, while heartbeats detect silence, traces reveal where an execution stopped progressing, and completion metrics show whether the intended business action actually occurred. OpenTelemetry describes traces, metrics, and logs as complementary signals: traces show the path of individual work, metrics show aggregate behavior, and logs retain detailed context. OpenTelemetry’s signal documentation provides the underlying model.
Track five signals for each production workflow
Define the signals before selecting alert destinations. This keeps monitoring focused on business-relevant failures rather than producing notifications for every technical event.
1. Arrival: did work enter the workflow?
Track whether expected work arrived. For a scheduled workflow, define a heartbeat: the run should begin within its schedule plus an agreed tolerance. For an event-driven workflow, measure the time since the last valid trigger against the business process it supports.
A nightly reporting workflow has a known schedule. A lead-routing workflow may have variable volume, so a fixed interval could create false alerts. In low-volume cases, a controlled synthetic event can verify that the trigger, credentials, and downstream path still work. Google SRE guidance recommends alerting on customer-relevant reliability indicators and identifies synthetic traffic as useful for low-volume services. The Google SRE Workbook’s SLO alerting guidance supports that approach.
2. Progress: did the work cross critical boundaries?
Record progress at business-critical boundaries rather than at every node. A document-processing workflow, for example, could record received, content_extracted, llm_validated, record_written, and stakeholder_notified.
Include a stable execution identifier, source record identifier, workflow version, and timestamp in those events. If work begins but does not reach record_written within its expected duration, the team can investigate the blocked stage instead of seeing only a late or missing final result. This is especially useful where queues, polling, external approvals, or long-running model calls are involved.
3. Completion: did the intended business action happen?
A workflow success status is not necessarily a business completion signal. Define completion only after the user-visible or operational effect is durable. For lead enrichment, completion might mean the required CRM fields are present and the record is assigned. For a support summary, it might mean a validated summary is attached to the ticket and the routing decision is written.
Use a stable business key so retries can recognize previously completed work. This reduces the chance that a retry after a durable write creates a duplicate. A completion event should represent a defined contract, not an assumption that the final workflow node indicates success.
4. Quality: was the LLM output usable?
An LLM provider can return a successful response that is not suitable for the business process. Apply deterministic checks before an output crosses an irreversible business boundary. Relevant checks can include required fields, allowed classifications, schema conformance, length limits, source availability, and prohibited-value checks.
Track validation failures separately from infrastructure errors. A rise in invalid outputs may point to a change in prompts, model behavior, retrieval quality, or upstream input data. The immediate action may be fallback processing or human review rather than repeating the same request.
5. Recovery: can failed work be found and replayed safely?
Set recovery boundaries explicitly. For each retryable dependency, define an attempt limit, backoff behavior, and total deadline. Once that boundary is reached, quarantine the work with its input reference, failure reason, attempt count, and correlation identifiers.
Dead-letter queues isolate work that could not be processed successfully so it can be inspected and later redriven. AWS documents this pattern for Amazon SQS, including a maximum receive count that moves messages aside after repeated processing attempts. AWS’s dead-letter queue documentation is specific to SQS, but the same operational pattern can be implemented through an appropriate queue, database record, or dedicated recovery workflow.
Alert on outcomes and deadlines
| Condition | Signal | First response | Urgency |
|---|---|---|---|
| No scheduled run within tolerance | Heartbeat or monitor check-in | Check the trigger, scheduler, credentials, and deployment state | High when timing matters |
| Execution starts but misses a critical stage | Trace duration and missing progress event | Inspect the blocked dependency and recover safely | High when a deadline is threatened |
| Workflow fails explicitly | Error event with execution context | Classify the failure as retryable, permanent, or uncertain | Medium to high |
| Completion drops or backlog grows | Business completion metric and queue depth | Check trigger volume, filters, and downstream delivery | Medium |
| LLM output fails validation | Quality-failure metric and quarantined item | Use fallback or review the item and its inputs | Usually medium |
The principle is outcome-first. A failed HTTP request may not require an urgent response when recovery succeeds before the business deadline. Conversely, a technically successful workflow may be urgent when its business completion count falls to zero. Alerts should make that distinction clear.
Use alert payloads that enable an immediate decision: workflow name, critical stage, execution identifier, business identifier, elapsed time or retry state, error category, owner, and a direct investigation link. Keep sensitive prompts, customer content, credentials, and full provider responses out of chat alerts. Store protected diagnostic material in an access-controlled system and link to it when needed.
Add heartbeat checks for silence
For scheduled workflows, send a monitor check-in when the run begins and when it completes. A missing expected completion can indicate that a run never started or did not finish. Sentry’s Cron monitoring API supports named monitors with ownership, configuration, and status settings, which can support this type of heartbeat design where Sentry is part of the operating stack. Sentry’s Create a Monitor API documentation describes the monitor resource.
For event-driven workflows, define silence from the business process rather than an arbitrary timer. Examples include no qualified lead processed during business hours, no file ingested after a known upstream export, or no ticket classification after a webhook change. Where natural traffic is sparse, run a clearly identified test item through a controlled path and verify its completion event.
Keep heartbeat monitoring independent from the workflow’s own error route. If a workflow never begins, its error handler cannot report the absence of that execution.
Use n8n error workflows for explicit failures
n8n supports workflow-level error handling through a separate error workflow using the Error Trigger. This can route failed execution context to an operational notification, incident record, or recovery process. n8n’s error-handling documentation describes the pattern.
Configure an error workflow for each production workflow that needs operational response. Include the workflow name, execution identifier, failing stage, business key, error class, retry status, and an investigation link. Use it for explicit failures, while relying on the separate cadence, progress, completion, and quality signals for failures that do not throw an error.
Connect workflow telemetry to the wider system
Self-hosted n8n can be configured to export OpenTelemetry telemetry. This makes it possible to correlate workflow activity with surrounding services and infrastructure instead of treating workflow executions as isolated events. n8n’s OpenTelemetry configuration documentation covers the self-hosted configuration path.
Use a shared correlation identifier across the trigger, n8n execution, queue message, model request metadata where supported, durable write, and notification. Start with a limited set of operational boundaries: trigger receipt, retrieval, model invocation, validation, durable write, and notification. Useful attributes include workflow version, model or provider, retry attempt, outcome, and error category. Review data-handling requirements before attaching customer identifiers or prompt content.
Set retry limits before failures compound
Classify failures as transient, permanent, or uncertain. Temporary provider unavailability and short-lived network errors may be transient. Malformed input, missing required records, and deterministic validation failures are more likely to require a different action. Uncertain failures need investigation because repeating the same call may not improve the outcome.
For every external step, document whether the operation is idempotent, how many attempts are permitted, the total time budget, and the destination after retries are exhausted. A retry is a recovery mechanism, not a monitoring strategy. The alert should state when work exhausted its recovery budget and where it was quarantined.
Production checklist
- Define a business completion event for every production workflow.
- Add a heartbeat or cadence detector for missing runs or missing arrivals.
- Emit progress events at critical business boundaries.
- Use stable correlation and business identifiers across telemetry and recovery records.
- Validate LLM outputs before irreversible writes or external notifications.
- Configure an n8n error workflow for explicit execution failures.
- Set retry limits, backoff behavior, deadlines, and idempotency expectations per dependency.
- Quarantine exhausted or invalid work in a reviewable recovery destination.
- Route alerts to a named owner with a clear first action.
- Test missed heartbeats, stalled executions, retry exhaustion, and validation failures.
FAQ
What is a silent failure in an LLM automation?
It is a business-relevant failure without a clear application error. It can include a missing workflow run, a stalled execution, a partial write, an output that fails validation, or an event that is never delivered downstream.
Is n8n execution history enough for monitoring?
No. It is useful for troubleshooting, but it requires manual review. Pair it with heartbeats, business completion metrics, error workflows, and alerts for missing or delayed outcomes.
When should an LLM failure be retried?
Retry failures that are plausibly transient and safe to repeat. Invalid structured output or bad source data should be quarantined or sent to a fallback or review path instead of being retried indefinitely.
What should the first alert contain?
Include the workflow and stage, execution and business identifiers, elapsed time or retry state, error category, owner, and an investigation link. Do not include sensitive payloads in the alert itself.
Sources
- n8n Docs: Error handling
- n8n Docs: All executions
- n8n Docs: OpenTelemetry
- OpenTelemetry Documentation: Signals
- Sentry API Documentation: Create a Monitor
- AWS Documentation: Using dead-letter queues in Amazon SQS
- Google SRE Workbook: Alerting on SLOs
Editorial note: AI assisted with research and drafting. Sources were selected for verification.

Full-Stack Developer & Solutions Architect · Casablanca, Morocco
8+ years building Java/Spring Boot/Angular enterprise solutions. Former Senior Software Engineer at NTT Data and Satec. Authorized Google Workspace and Microsoft 365 Partner for Morocco.